
See what every plot decision means for the whole development
PloTwin connects plot feasibility, development phasing and masterplan cash flow. Compare options, understand funding needs and prepare investment decisions from one connected model.
Built for master developers, development teams and real estate finance professionals.

Delay one plot by two years. Here is what changes.
| On plan | HP-01 two years later | Change | |
|---|---|---|---|
| Peak funding | AED 1,329.6M | AED 1,440.1M | +AED 110.5M |
| Project IRR | 16.17% | 15.55% | −0.62 pts |
| NPV | AED 400.4M | AED 360.6M | −AED 39.8M |
| Development cost | AED 3,576.7M | AED 3,599.0M | +AED 22.3M |
| Profit | AED 1,311.9M | AED 1,289.6M | −AED 22.3M |
Harbour Point demo, 7 plots with revenue. Plot HP-01 (residential, 420 units) moved from a 2026 start to 2028; nothing else changed. Figures rounded to one decimal; changes calculated from unrounded values.
Why the figures moved
- Building later costs more. Construction costs rise 3% a year in this demo, so HP-01's cost goes up by AED 22.3M.
- Its spending moves. HP-01 now draws funds in 2028–2030, when other plots are also building, so the plan's peak funding rises by AED 110.5M.
- Its revenue arrives later. The same sales, received two years later, are worth less today: NPV falls by AED 39.8M and IRR by 0.62 points.
In PloTwin this is one change on the Phasing view. Every affected plot re-runs straight away; save it as a scenario for the committee, or undo it.
Masterplan, plot and scenario in one model
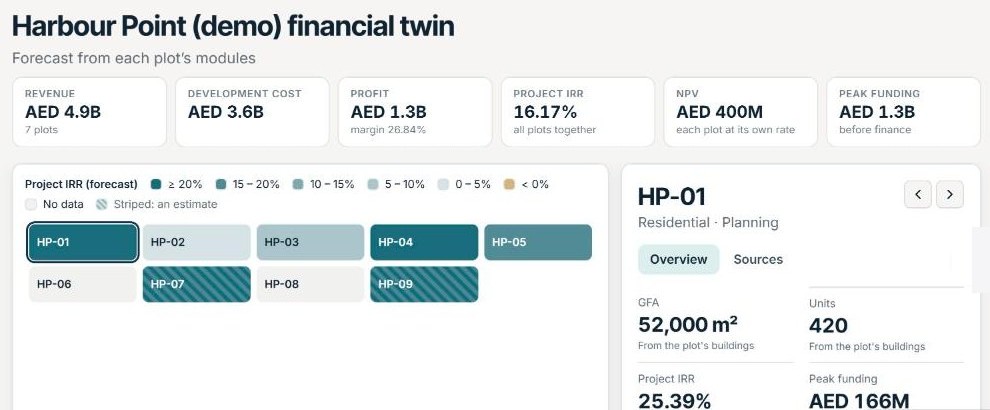
Every plot runs through the same modules: land use, market, construction, financial, payment plans, service charges and lifecycle costs. The masterplan adds them up as they change.
See the whole plan at once
Revenue, development cost, profit, IRR, NPV and peak funding for every plot together.

Find the plot behind the number
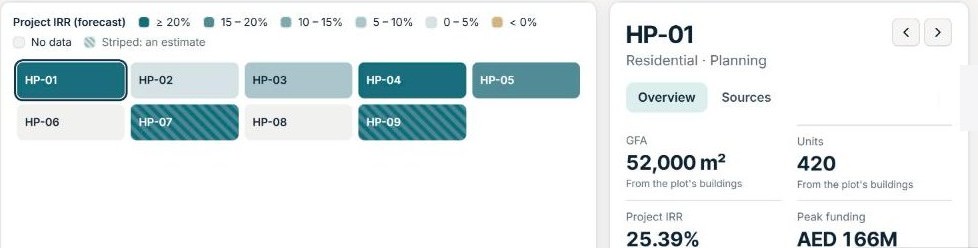
Each plot is coloured by its return. Striped plots are estimates from their buildings until someone runs a full model, so you can tell estimates from fully modelled plots.
Open its full financial model
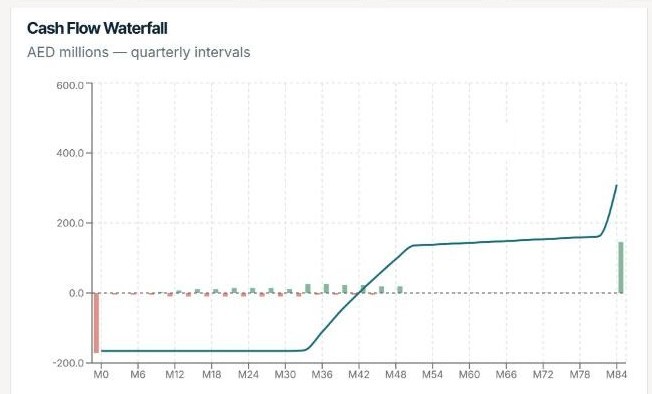
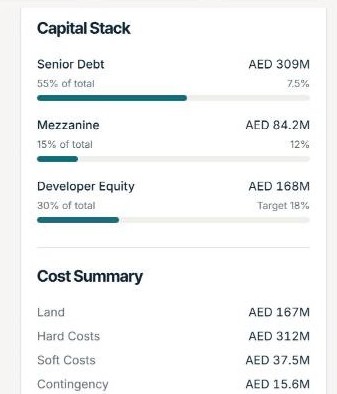
Project and equity IRR, NPV, payback, DSCR and equity multiple, with the cash flow and the capital stack behind them. Goal-seek, sensitivity and break-even run on the same model.

Compare options before you commit
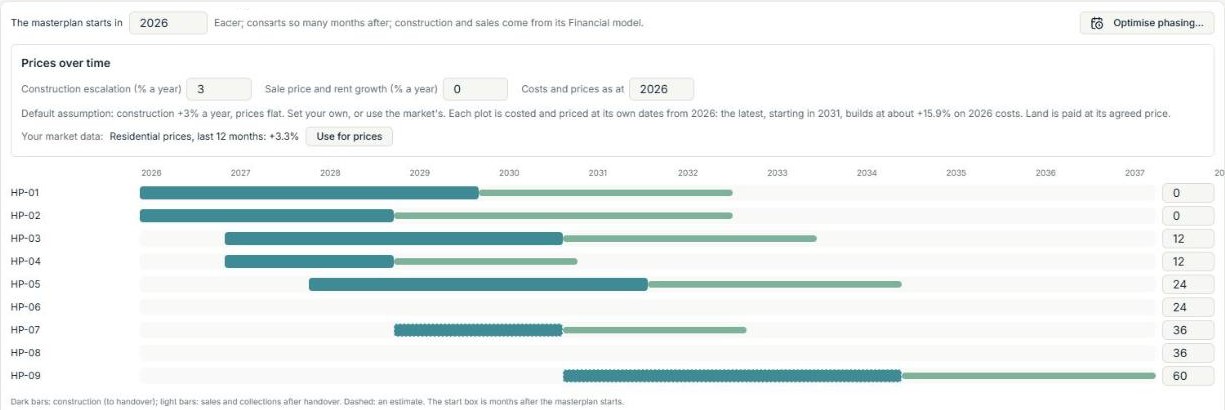
Every plot's construction and sales on one timeline. Change a start, set how fast costs and prices move, or let the optimiser suggest when each wave should start; PloTwin re-runs every affected plot and compares the result with your saved baseline.
One model that Finance and Development can both use
Finance
- Where funding peaks, and when, across every plot's own schedule
- What a delay or a change of mix does to IRR, NPV and profit
- Monthly actuals that re-forecast the plan against its baseline
- A workbook with live formulas Finance can audit
Development
- Which plots to start first, and what each start date costs
- Plot mix, densities and open space, tested against the whole plan
- Plot passports read into the model, changing only the plots they cover
- Checks wherever two modules disagree on the same number
Committee and lender materials from the same numbers
Samples from the Harbour Point demo, exactly as PloTwin produced them.
Every figure can be traced, checked and approved
- Sources: each value records where it came from: a plot passport, a market guide or a person.
- Checks: PloTwin flags any number two modules disagree on, and asks you to resolve it.
- Human review: AI reads documents and drafts text; nothing is applied until someone approves it.
- Your workspace: only people you invite can see your plans, and their role decides what they can change.

PloTwin was founded by Mohammed Shehata, former Senior Vice President of Asset Management and of Technology at a major Dubai master developer. It is built for the point where plot decisions, phasing and funding meet.
Chartered Engineer · 25+ years in real estate, smart cities and data centres · Read more
Evaluate PloTwin through a six-week pilot
We walk through the Harbour Point demo and your questions.
5–10 of your plots, tested against your own reference models, with criteria your Finance team sets.
You judge the results, then decide on scope and the plan that fits.